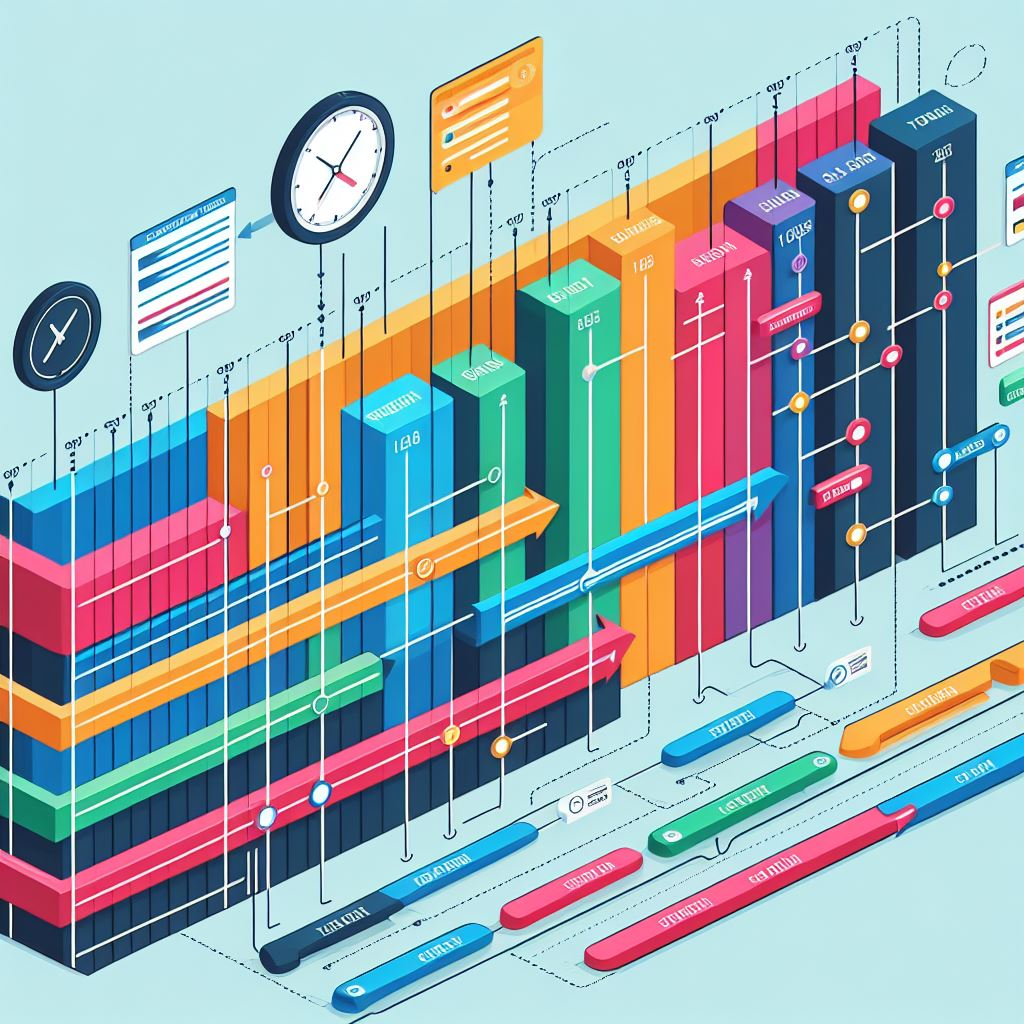
In my day-to-day experiences managing projects, I’ve discovered that a Gantt chart is more than just a tool; it’s a roadmap for success. This graphic display simplifies complex schedules into a user-friendly format that engages my entire team. For clarity, a Gantt chart displays schedules as bars along a calendar, with activities listed on one side and dates spread across the top. It turns abstract lists into concrete plans.
Visual clarity is a universally appreciated benefit of Gantt charts. They offer a visual timeline that captures the entirety of a project from start to finish. Imagine being able to glance at a chart and immediately understand where an activity is in the project lifecycle, how long it will take, and which activities are happening concurrently or depends on others whilst visually seeing the logical relationships. This immediate clarity streamlines communication and demystifies project timelines for everyone involved.
It’s undeniable that Gantt charts also act as an invaluable compass for navigating project timelines. Just like a navigator uses a map, my team uses the Gantt chart to identify essential milestones, understand the sequence of activities, and trace the critical path. Detail-oriented at its core, it can dive into task-level intricacies if needed, displaying individual tasks, their dependencies, and the responsible team members. These elements prepare the project team, fostering a shared understanding and a collective drive to meet the project’s objectives.
Optimizing Resources and Tracking Progress
Resource management is a cornerstone of any project’s success. By using Gantt charts, project planning managers don’t just schedule activities; they can also assign and manage resources to ensure productivity. Each row on the chart signifies a set of resources, be it a team member, a piece of equipment, or a financial asset. This layout coupled with resource usage profiles, it allows for a comprehensive view of who is doing what and when, and with resource leveling it avoids any one resource from being over or under allocated.
Another crucial component of a project’s trajectory is tracking its progress against its planned baseline. Gantt charts excel in providing a visual juxtaposition of actual performance versus planned deadlines. When a task is behind schedule, the discrepancy is immediately evident, prompting swift corrective action. This kind of real-time update is indispensable not just internally within the project team but also for external reporting to stakeholders.
Monitoring the course of a project can be like a ship navigating through rough waters. Important dates like project gates are the lighthouses guiding the way, and Gantt charts highlight these beacons effectively. Milestones, represented by symbols such as diamonds, shine brightly amidst the sea of bars, reminding teams what they are steering towards. As clear markers of progress, they are pivotal points around which discussions on project status can revolve.
Facilitating Collaboration and Transparency in Teams
Gantt charts aren’t just about plotting activities on a visually appealing timeline. They act as a catalyst for team collaboration and transparency. In project management, open communication forms the basis of project success.
I find it crucial to lay out biases at the onset, as this honesty sets the stage for effective teamwork. Having used Gantt charts myself, I can attest that nothing supports a culture of openness quite like a well-maintained Gantt chart. It’s a transparent scheduling method that displays not just when tasks are due but the sequence and dependencies that bind them.
Adopting agile and lean methodologies, Gantt charts can still be of use as it can offer a visual narrative of the project schedule along with burndown charts. This is vital in keeping everyone on the same page and ensuring that all team members understand their roles and deadlines.
Furthermore, Gantt charts serve as an essential tool for capturing changes and fostering collaboration. They can be updated to reflect the dynamic nature of projects, which in turn helps in building trust amongst team members as they visibly see the schedule evolve with their input.
When it comes to trust, a transparent Gantt chart reflects both the activities at hand and the collective efforts to adapt to new circumstances. What’s impressive is that they make the complex web of project tasks digestible, providing a common ground for discussion, whether with client, suppliers, or team collaborators.
Navigating Pitfalls: The Limitations of Gantt Charts
While Gantt charts stand out as powerful tools in project management, it’s my responsibility to guide you through their limitations too. For projects scaling on the larger and more complex end, Gantt charts can feel like trying to read a book through a keyhole – a bit cluttered and overwhelming making it hard to follow through and interpret. Gantt charts with high-level granularity can be time-consuming and difficult to update. They’re fantastic for the big picture view but might skip out on task-specific details like risks or work breakdowns.
Consider traditional Gantt charts like a snapshot. Although an experienced planner can develop a dynamic schedule model, when it comes to visualizing it in a Gantt chart it is static, hard to interpret changes in real-time. They capture a moment but don’t automatically update. When your project scope experiences frequent changes, it will become challenging to preserve accuracy or even completeness of the status of project. To counter that, frequent instances and updates become a necessity making the entire process counterproductive.
Gantt charts keep their eyes on the time dimension, making sure activities align with due dates. But they’re not that great at peering into the quality of work produced. Tracking progress in terms of completion? Yes. In terms of quality? Not so much.
Remember the beautiful orchestra of activities and timelines that your Gantt chart started as? Add a few complex interdependencies or frequent changes, and that can quickly turn into a maze of lines and bars that needs a full-time scheduler to keep it tidy and aligned with the best practices of schedule modeling in order to avoid open-ended activities, out of sequence logic, invalid dates, to name just a few.
And finally, your choice of Gantt chart software can be a double-edged sword. Some can come at a steep price or require climbing the steep cliff of learning curves. Others are not mature with limited capabilities compared to Primavera P6 and Microsoft Project. This may hinder your team’s ability to jump right in and use the tool effectively to provide visibility, anticipate, and monitor the critical path.
To wrap up, Gantt charts are remarkable for managing many aspects of project scheduling, but they are not a one-size-fits-all solution. Understanding their limits is just as crucial as leveraging their strengths. It ensures that your use of Gantt charts aligns with the realities of your project—a balance that any seasoned project planning manager aims to achieve.

